

NAPLES, BONITA SPRINGS AND ESTERO
Closed Sales
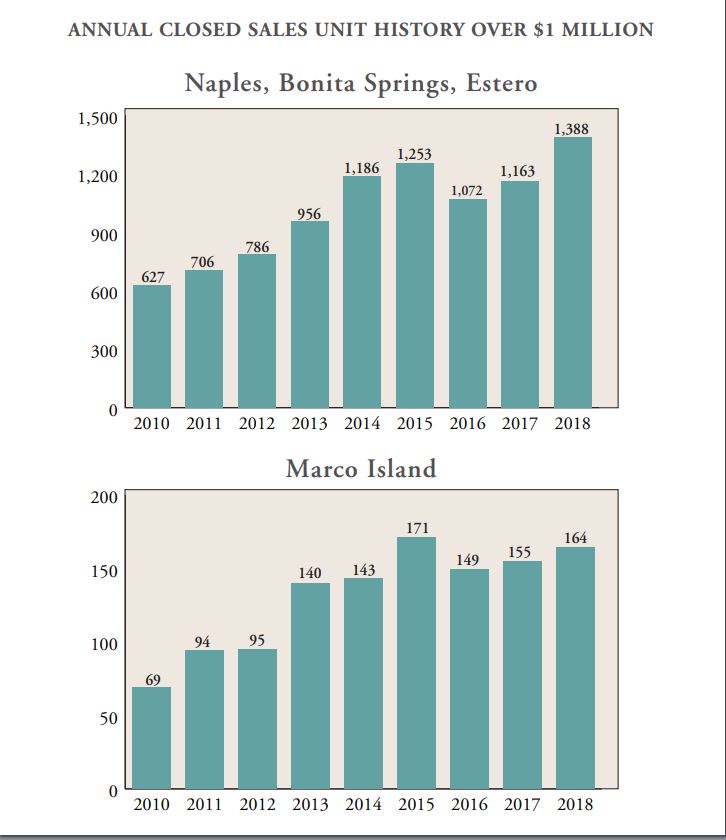
The overall number of closed sales increased compared to 2017, up 6% from 11,872 to 12,599. Properties priced at $1 million and above increased 19% over 2017 with 1,388 sales versus 1,169 in 2017. Properties priced at $5 million and above posted a 26% increase, with 88 closings in 2018 compared to 70 in 2017.
Inventory Levels and New Listings
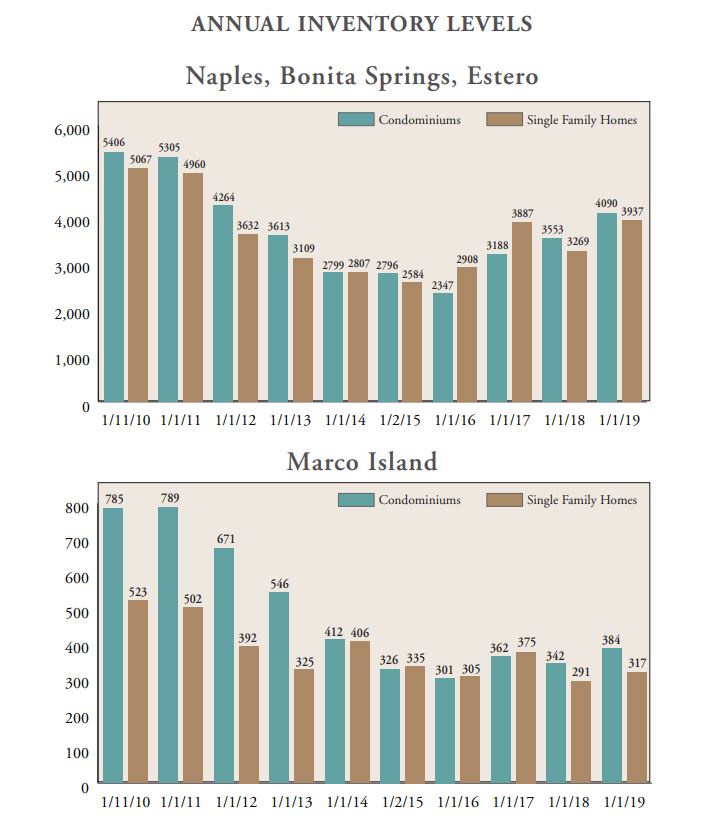
During the second half of the year, following twelve months of modest year-over-year decreases in available inventory, inventories started to grow when compared to the prior year. Despite that fact, months of supply held between 6.1 to 8.1 months over the course of the year, reflecting continued balanced market conditions. As of January 1st, the market remains in check with 7.7 months of available inventory. The number of new listings placed on the market in 2018 was down 3.9% from 19,307 to 18,556. Even with this decrease in new inventory, the number of total available listings compared to a year ago has risen by 18%, from 6,822 to 8,027. The supply of condominiums increased 15% while single-family home supply increased 20% over the same period last year, each still showing balanced months of inventory at 7.8 and 7.5, respectively.
Pended Sales
The overall number of sales pended during the year was up by 6.5% to 16,251. This increase was mainly due to growth in the $1,000,000 to $2,500,000 price range, while other price categories reflected fewer pending sales when compared to the prior year. It is important to note that not all pended sales close. However, this benchmark, along with current inventory has proven to be the best leading indicator of market direction.
Summary
In summary, closed sales volume in Naples, Bonita Springs, and Estero has posted two years of YoY growth, and the median price continues to increase, albeit at a rate slower than prior years. Months of supply reflect a balance between the number of active listings and the pace of sales. However, inventory has increased for both single family and condominium product while new listings are generally down, indicating longer market exposure for existing listings. Considering these emerging trends, as well as a supply of new homes not reflected in this report, resales could experience challenges in some areas.
MARCO ISLAND
Closed Sales
The number of closed sales in 2018 was consistent with 2017 with 846 and 853 sales, respectively. Properties priced above $1 million increased by 5.8% when compared with 2017, with 164 sales at the end of 2018 vs 155 at the end of 2017.
Inventory Levels and New Listings
With 701 listings on the market at year’s end, inventory increased 15% compared to the same time last year when the year-end inventory was 610, the lowest since 2014. The supply of condominiums increased 12% over the same period, and single-family inventory increased by 9%. Months of supply as of the end of 2018 was 9.9, an increase of 16% when compared to the same time last year. Six to twelve months of supply is generally considered a balanced market. The increase of inventory over the past year has outpaced the rate at which new listings were added to the market, indicating a longer time on the market for existing inventory.
Pended Sales
Although pended sales are up from 2016, the number of sales pended during 2018 was static with the prior year at 1,035. It is important to note that not all pended sales close. However, this benchmark along with current inventory has proven to be the best leading indicator of market direction.
Summary
Although the pace of closed sales only decreased slightly, inventory rose at a faster rate, moving months of supply a bit further from the center of what would generally be considered a balanced market. Sellers should consider these factors when pricing properties for sale this season.


JODEE BENNETT, REALTOR® | JOHN R. WOOD PROPERTIES 239.631.2561
